


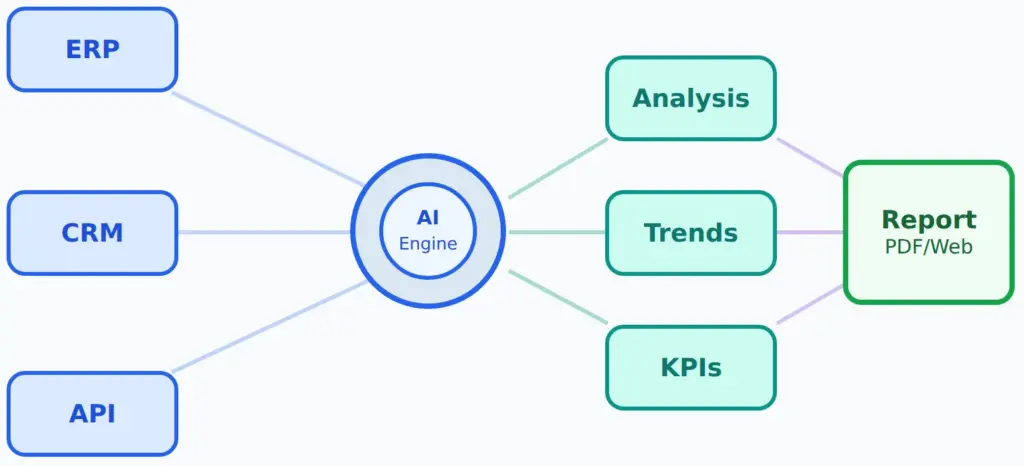
Anyone making decisions today needs current data – not tomorrow, but now. AI reporting systems turn raw data from ERP, CRM and APIs into decision-ready documents fully automatically. What used to take hours, AI does in seconds – precisely, at scale and potentially GDPR-compliant.
Introduction
Data is everywhere – but decisions need more than numbers. Anyone who runs a company, leads a department or carries strategic responsibility today faces an apparent paradox: there has never been so much data available, and it has never been so hard to draw the right conclusions from this abundance quickly. This is exactly where one of the most effective applications of modern AI comes in: automated report generation.
This article shows what the path from unstructured raw data to a decision-ready document can look like today with AI support. In short: AI reporting is the approach that makes it possible.
Why classic reporting processes reach their limits
In many organizations, reporting still follows the same pattern: an analyst exports data from various systems, cleans it manually in Excel, assembles charts, writes a comment and sends the result as a PDF up the hierarchy. That costs time – often hours per report – and introduces considerable sources of error.
Automating reports requires a deep understanding of the underlying data structures. For an efficient implementation and adaptation of these systems, expertise in AI programming is indispensable.
On top of that, a finished report is often already outdated the moment it is sent. Markets move faster than weekly reporting cycles. Data sources multiply. The expectations placed on decision-makers – quick, well-founded decisions based on current facts – keep rising.
Caution: The ability to generate arbitrary reports for arbitrary data (thanks to AI) comes at the price of possible inaccuracy and unreliability.
Reporting can only be made very reliable when it is focused!
Three core problems of classic reporting processes can be identified:
High manual effort: Aggregating and preparing data from various sources (ERP, CRM, marketing tools, databases) ties up qualified employees in repetitive tasks.
Susceptibility to errors: Manual copy and transformation steps are one of the most common causes of errors in reports – with sometimes considerable consequences for decisions.
Poor scalability: The more reports, departments and data sources are added, the more disproportionately the effort grows.
What AI-powered reporting can do – and what it cannot
Before getting specific, a realistic assessment is worthwhile. AI in reporting is not a cure-all and not a black box that you switch on once and that then produces perfect reports on its own. AI is a powerful tool within a well-thought-out process.
What AI-powered reporting can reliably do today:
- Merge and normalize raw data from heterogeneous sources
- Statistically detect patterns, outliers and trends
- Generate natural-language summaries and interpretations
- Structure and fill reports according to predefined templates
- Prepare reports in different formats and for different target groups
- Fully automate recurring reporting
What AI does not replace:
- Responsibility for the substance of decisions
- Professional judgment in complex matters
- Quality assurance and plausibility checks by subject-matter experts
- Creative strategy development beyond the available data
When using AI, the AI Act must also be taken into account. It is easy to comply with, though, if you know what to look out for. Reporting is also typically not a high-risk AI system that would require more attention.
The architecture of an AI reporting system
A modern AI-powered reporting system typically consists of four layers that build on one another.
1. Data collection and integration
Everything begins with the raw data. It comes from a wide range of sources: relational databases (PostgreSQL, MySQL, MSSQL), cloud services, structured data files (CSV, Excel), APIs or even unstructured sources such as emails and documents.
A robust ETL system (Extract, Transform, Load) or more modern ELT approaches ensure that this data is merged, cleaned and brought into a consistent form. Tools such as Apache Airflow, Data Build Tool or simpler Python-based pipelines are used here.
Key question: How current does the data need to be? Batch processing (daily, hourly) is enough for many strategic reports – operational dashboards require near-real-time processing.
2. Analysis and pattern recognition
In the second step, AI models take over the actual analysis. Depending on the use case, different techniques are used:
Statistical methods and classic machine learning are excellent for trend analysis, anomaly detection and forecasts. A random forest model for sales forecasting, a clustering algorithm for customer segmentation – these are proven, easily explainable methods.
Large Language Models (LLMs) such as Claude Sonnet/Opus/Fable, GPT-5, or powerful open-source models take the next step: they interpret numbers and patterns and translate them into natural language. From a data set of revenue figures, an LLM can not only recognize that revenue rose by 12% in March, but also put this increase into context, point to possible causes and formulate what it could mean for the coming months.
 My name is Klaus Meffert. I have a doctorate in computer science and have been working professionally and practically with information technology for over 30 years. I also work as an expert in IT & data protection. I achieve my results by looking at technology and law. This seems absolutely essential to me when it comes to digital data protection. My company, IT Logic GmbH, also offers consulting and development of optimized and secure AI solutions.